
The Three Contenders#
- Standard
forloop: Manual iteration (pre-allocated). lapply: The functional, sequential R standard.future_lapply: The parallelized version.
Experiment 1: The “Cheap” Task#
In this scenario, we do something very fast: calculating the mean of 1,000 numbers.
n <- 200
data_list <- replicate(n, rnorm(1000), simplify = FALSE)

bench_cheap <- microbenchmark(
  for_loop = {
    res_for <- vector("list", n)
    for (i in 1:n) res_for[[i]] <- mean(data_list[[i]])
  },
  standard_apply = lapply(data_list, mean),
  future_apply = future_lapply(data_list, mean),
  times = 10
)

# Generate Table
kable(summary(bench_cheap), caption = "Cheap Task Results (milliseconds)")| expr | min | lq | mean | median | uq | max | neval |
|---|---|---|---|---|---|---|---|
| for_loop | 1507.353 | 1528.993 | 2088.8757 | 1886.9765 | 2247.506 | 3612.795 | 10 |
| standard_apply | 579.942 | 593.286 | 650.1938 | 620.8995 | 646.442 | 972.261 | 10 |
| future_apply | 43903.082 | 66857.227 | 80391.6234 | 83932.7115 | 90847.894 | 133924.993 | 10 |
Cheap Task Results (milliseconds)
# Generate Figure
autoplot(bench_cheap) +
  labs(title = "Cheap Task: Parallel Overhead is Visible")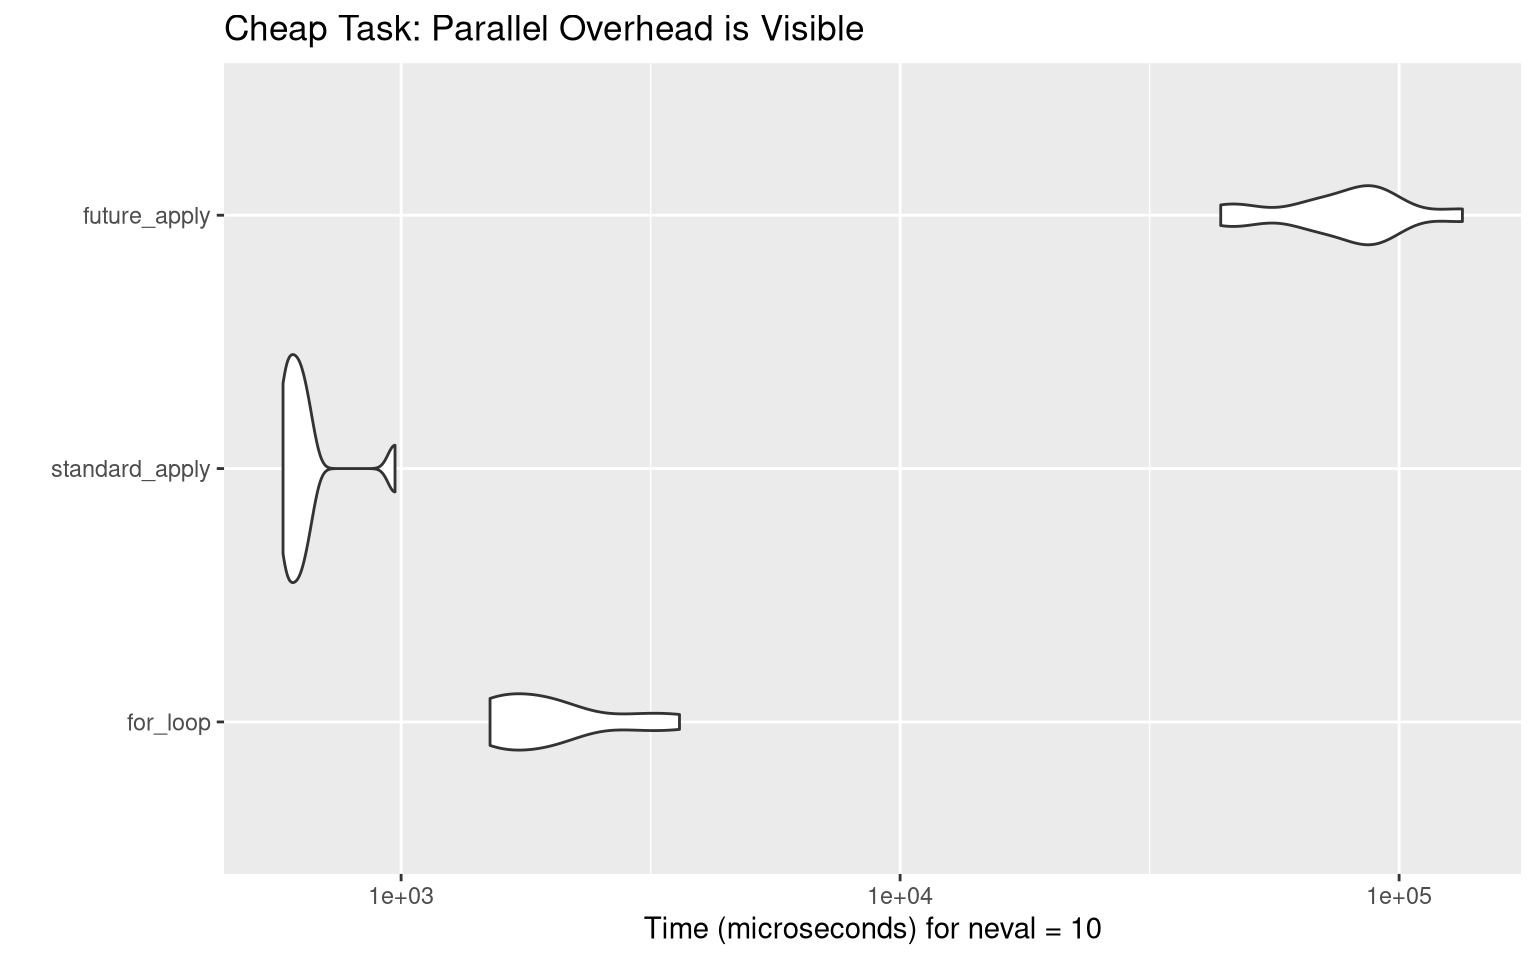
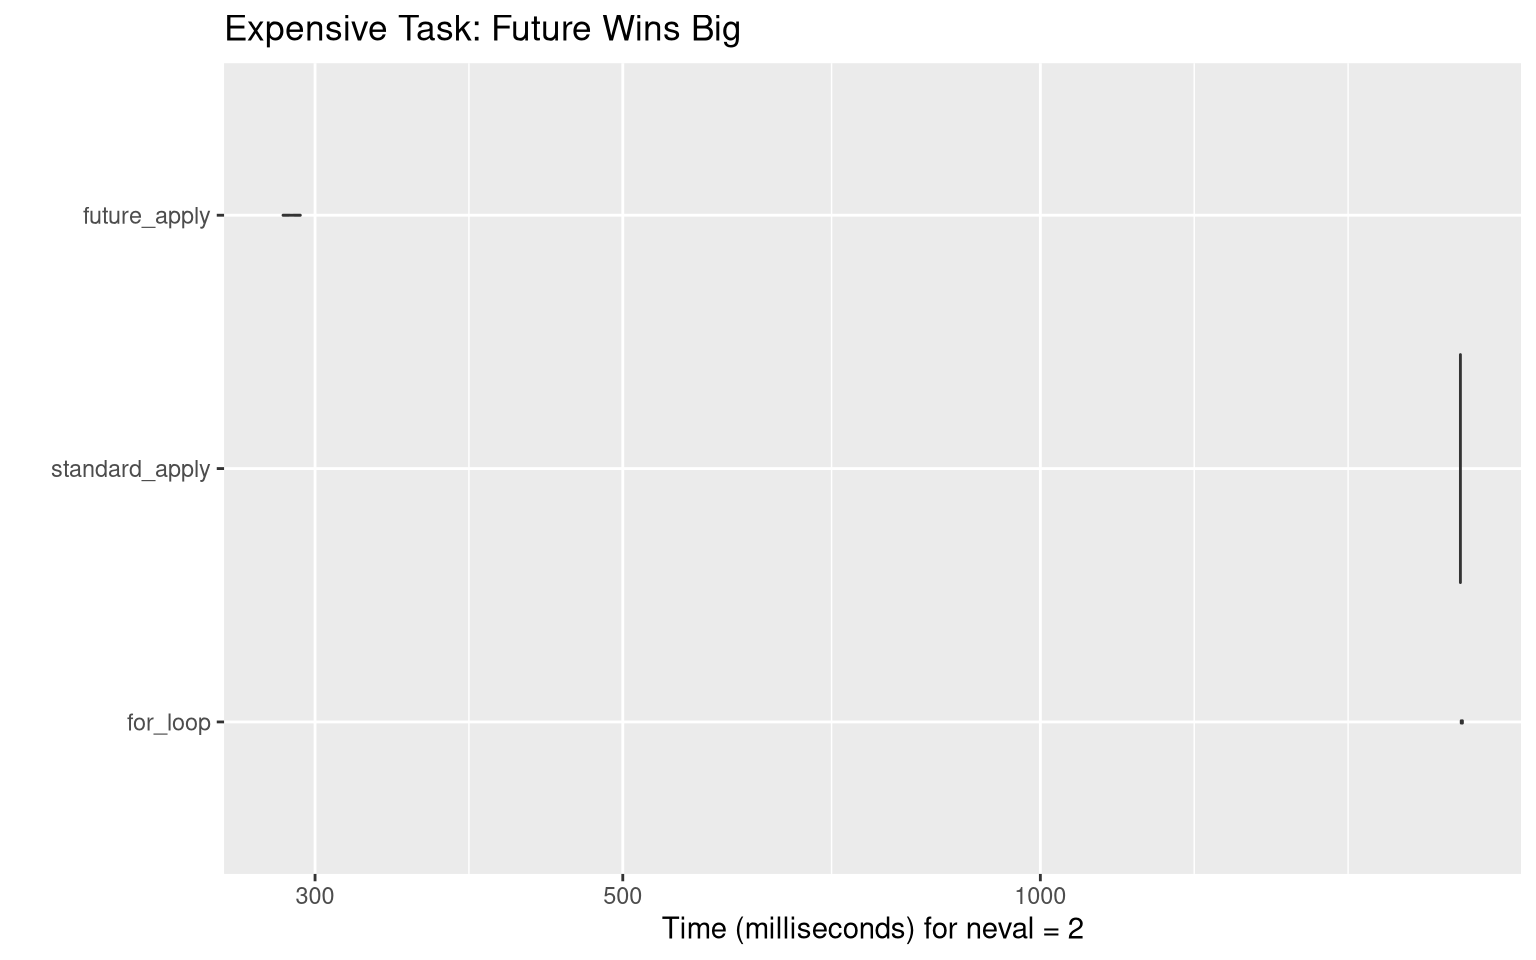
Experiment 2: The “Expensive” Task#
In this scenario, we simulate “heavy” work by adding a tiny delay (Sys.sleep). This mimics complex statistical modeling or web scraping.
n_heavy <- 20
data_heavy <- replicate(n_heavy, rnorm(10), simplify = FALSE)

# A function that takes 0.1 seconds per call

heavy_func <- function(x) {
  Sys.sleep(0.1)
  mean(x)
}

bench_expensive <- microbenchmark(
  for_loop = {
    res_for <- vector("list", n_heavy)
    for (i in 1:n_heavy) res_for[[i]] <- heavy_func(data_heavy[[i]])
  },
  standard_apply = lapply(data_heavy, heavy_func),
  future_apply = future_lapply(data_heavy, heavy_func),
  times = 2 # Low iterations because it's slow!
)

# Generate Table

kable(summary(bench_expensive), caption = "Expensive Task Results (seconds)")| expr | min | lq | mean | median | uq | max | neval |
|---|---|---|---|---|---|---|---|
| for_loop | 2010.9176 | 2010.9176 | 2012.9459 | 2012.9459 | 2014.9741 | 2014.9741 | 2 |
| standard_apply | 2008.2429 | 2008.2429 | 2008.2641 | 2008.2641 | 2008.2853 | 2008.2853 | 2 |
| future_apply | 284.4746 | 284.4746 | 288.6135 | 288.6135 | 292.7524 | 292.7524 | 2 |
Expensive Task Results (seconds)
# Generate Figure

autoplot(bench_expensive) +
  labs(title = "Expensive Task: Future Wins Big")